A multi-year study of a changing landscape.
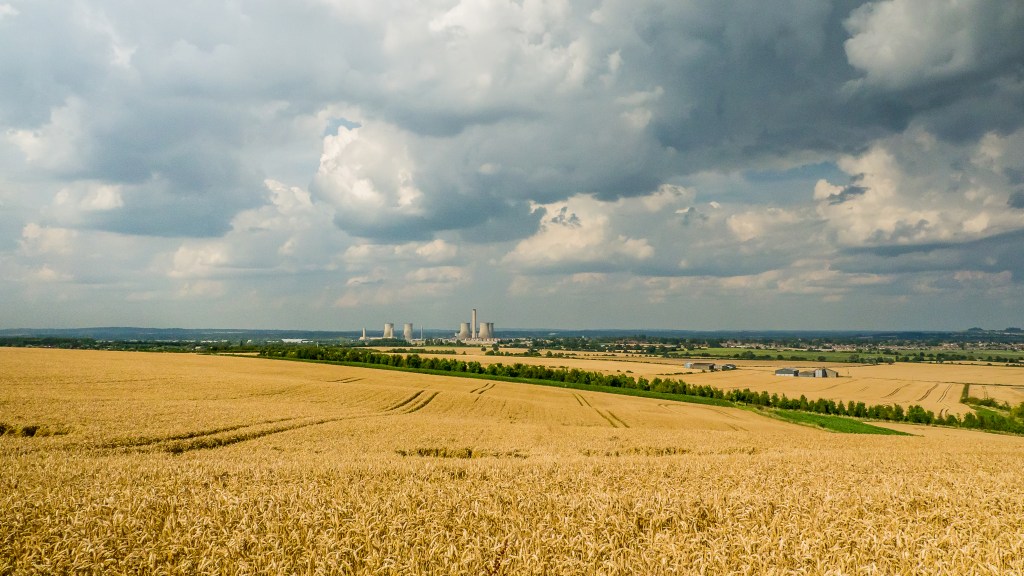
I have always been fascinated by the place of Didcot Power Station in the landscape. Knowing that it was going to be shut down and demolished, I wanted to document the event of the changing landscape and the impact of the changes. I realised it would be a unique opportunity to see the construction process in reverse.
Gibberd’s map is unique in placing Didcot and the power station at the centre of the map, and it is beautifully drawn. It is sparse, containing only the essential contours of the landscape, the River Thames and the main roads between principal destinations at the time it was drawn sometime in the late 50s – early 60s. It also depicts a huge area of the valley, some 40 miles east to west along the valley and 30 miles north to south. The Thames valley is very flat, but bounded along its southern edge by the incredible undulating landforms of the North Wessex downs and the sharp edge of the Chiltern Hills in the East.
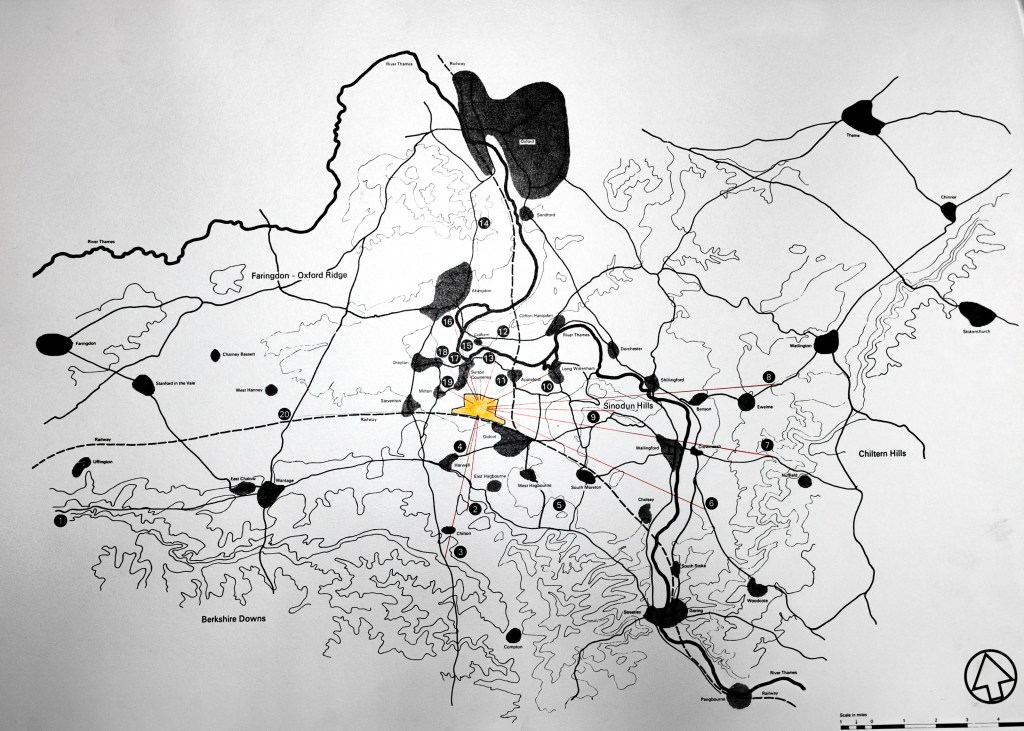
The map also has a web of lines and numbered dots radiating out from the centre, and it turns out these are viewpoints that Gibberd used to figure out how best to integrate the enormous industrial monolith of the power station into the very different landscape of the valley and surrounding downland.
I saw the map, and I knew that this was my code to unpick the relationship between the landscape and the power station, and at the same time go on a journey following in Gibberd’s footsteps, and trying to see the world as he would have seen it all those years ago.
Frederick Gibberd:
Building mass and the region
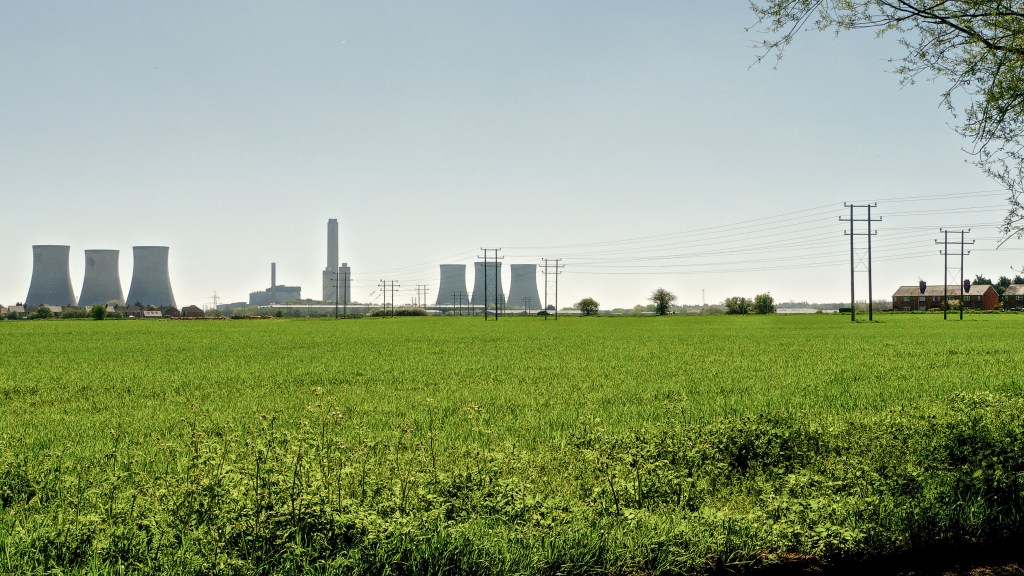
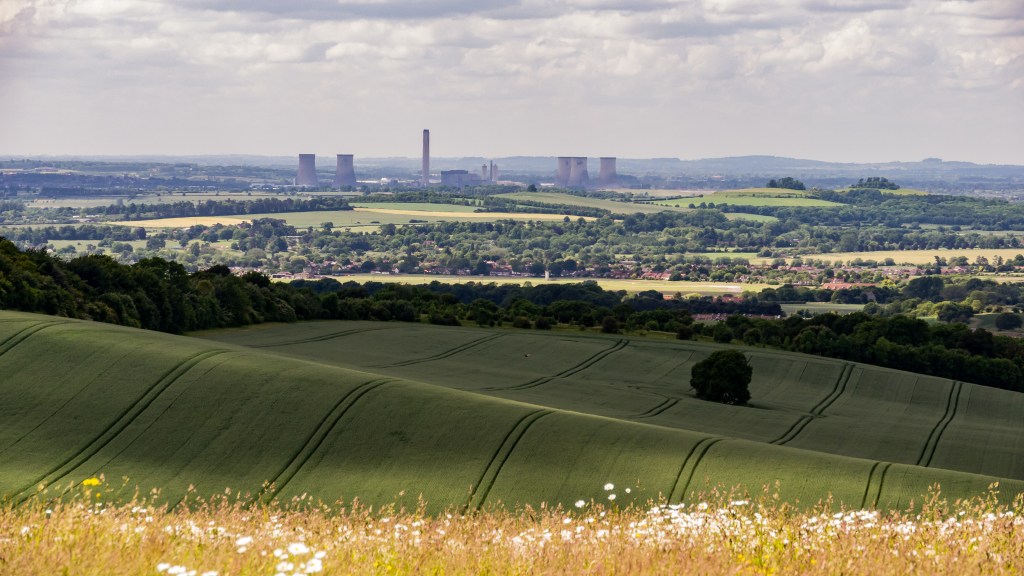
The preliminary layouts showed a 2,000 megawatt station with eight 375ft high cooling towers and a stack 650ft high. The site is at the general level of the valley plain, making it completely exposed from the surrounding hills and with the consequence that the tops of the cooling towers are only slightly below the crest of the hills. They will come into a very large range of rural views hitherto undisturbed by industrial objects. They will dominate Wittenham Clumps, a local feature of considerable topological and historical importance, lying on the river plain and within three and a half miles of the station.
Grouping of towers
The second problem examined was the placing of the cooling towers in the site in relationship to the distant views. The most functional arrangement is, we understand in two parallel rows of four towers each. On a north south axis, eight towers in one group look extremely massive, particularly when viewed from the east or west. We decided, therefore, that the towers must be divided into two groups in order that the overall mass should be broken down and that the groups should be equal in size.
Views from the Chiltern Hills and Wittenham Clumps suggest that the groups should be site on a north south axis in order to provide a gap between the groups when seen from the east. There are also important views from the Berkshire Downs as far east as Gore Hill. We decided that if the tower group are positioned on an approximate north west to south east axis, then the gap between the towers can be maintained for both viewpoints.
2. Hagbourne Hill

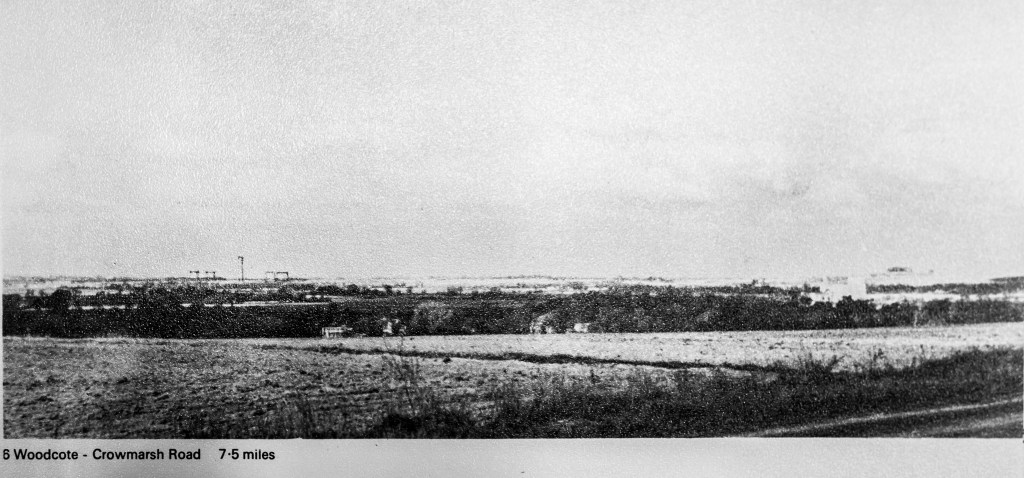
6. Woodcote – Crowmarsh Road

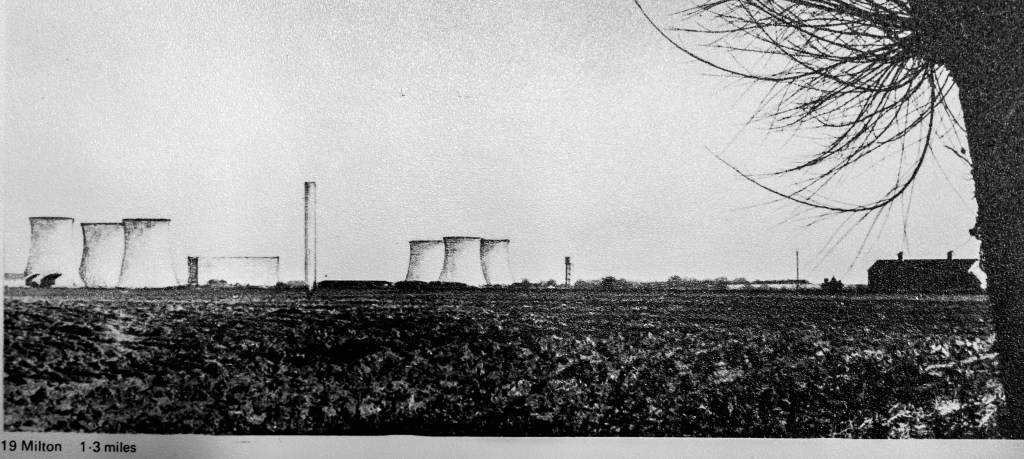
19. Milton
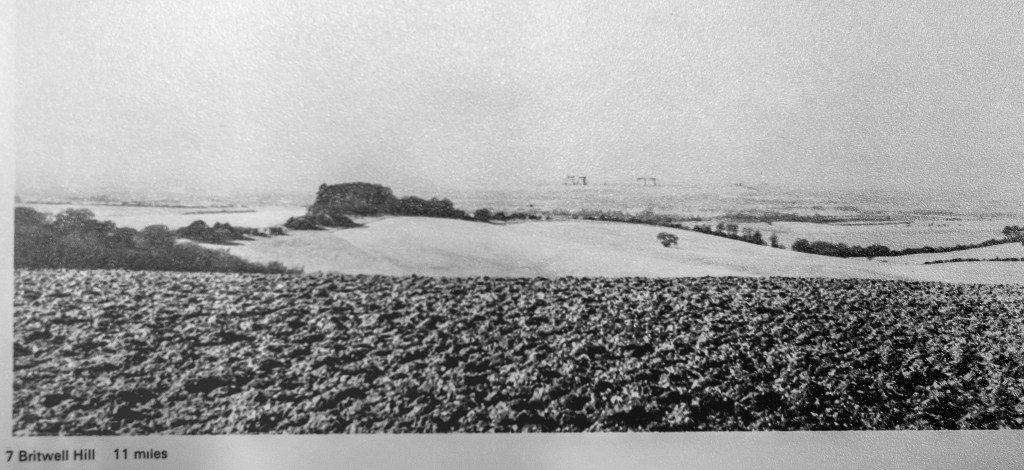
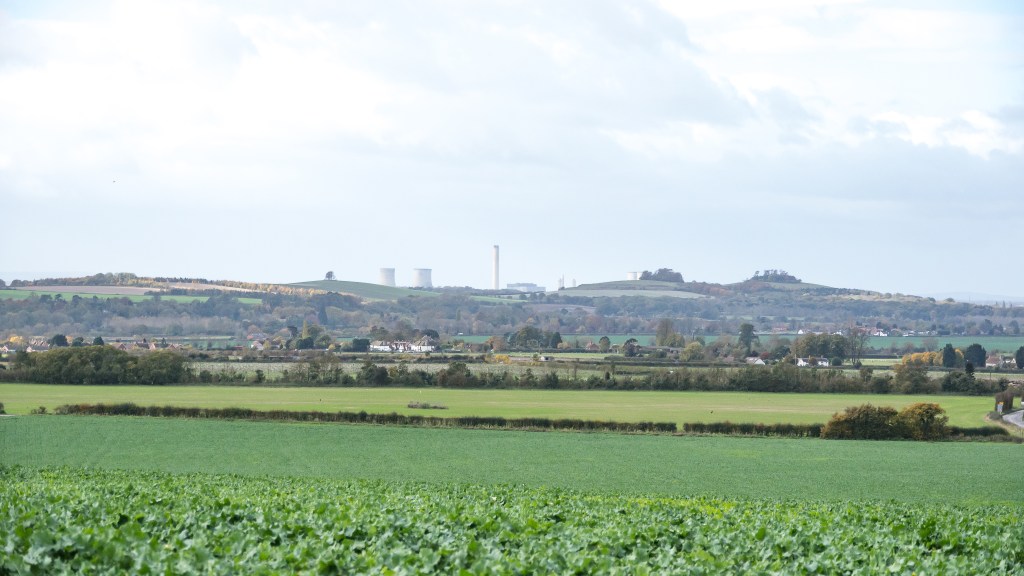
7. Britwell Hill
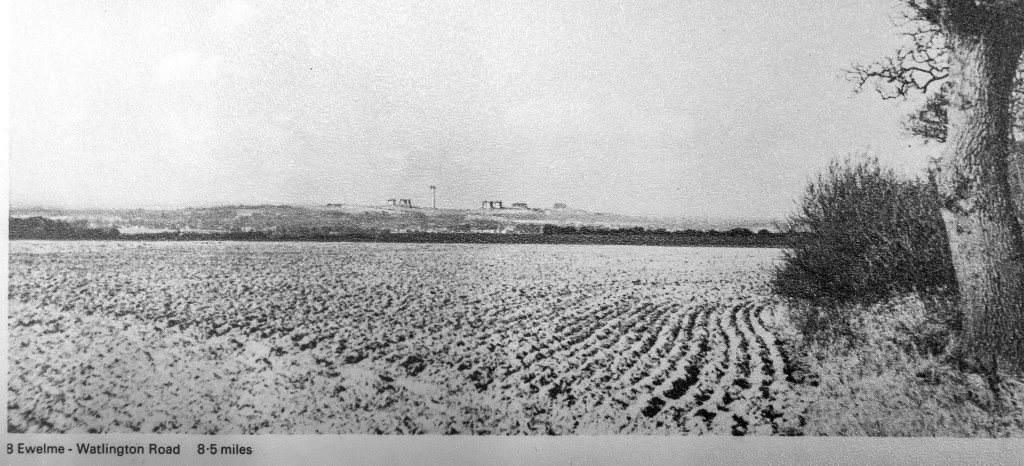
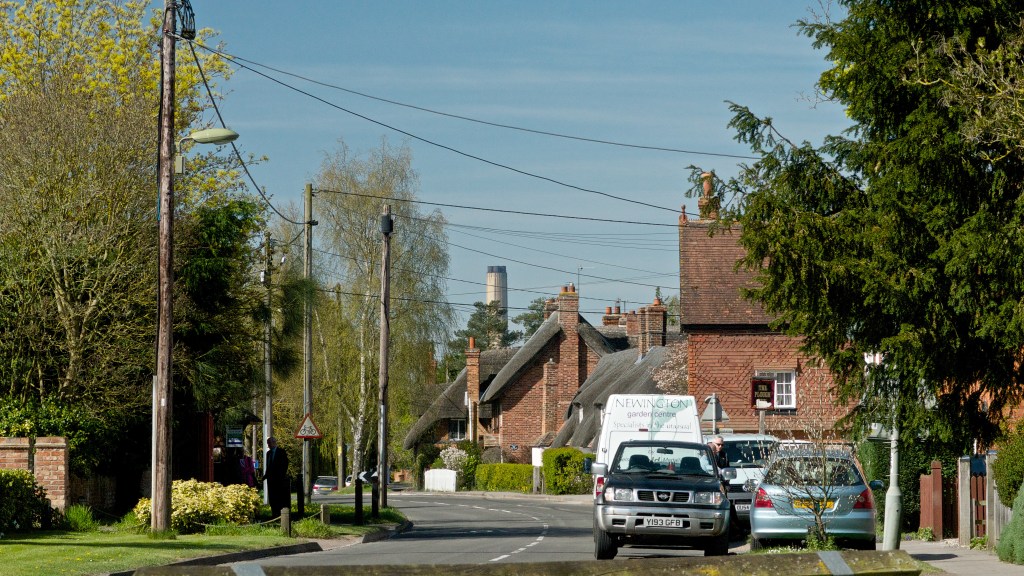
8. Ewelme – Watlington Road
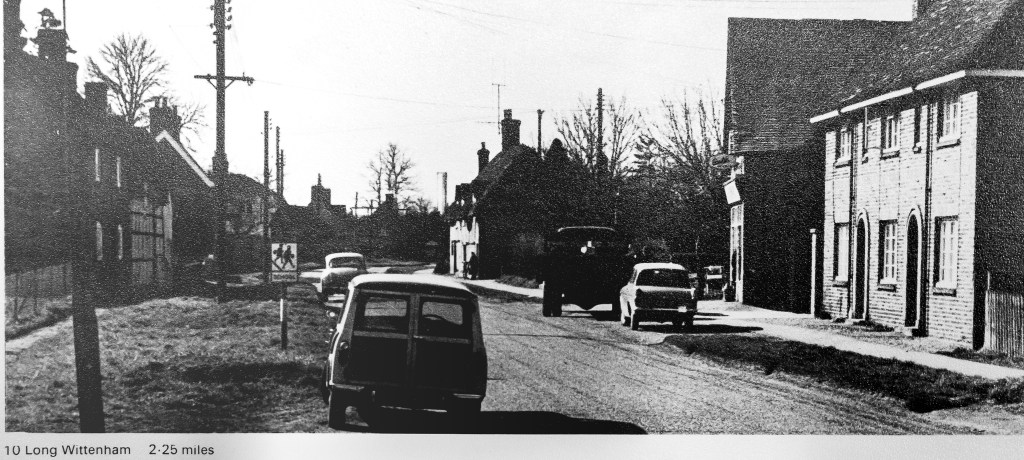
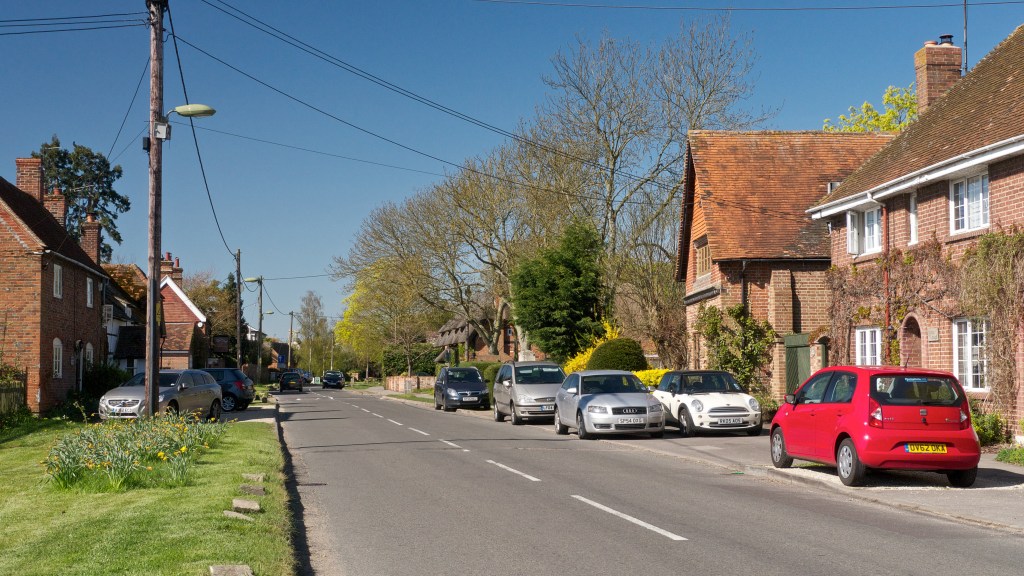
10. Long Wittenham
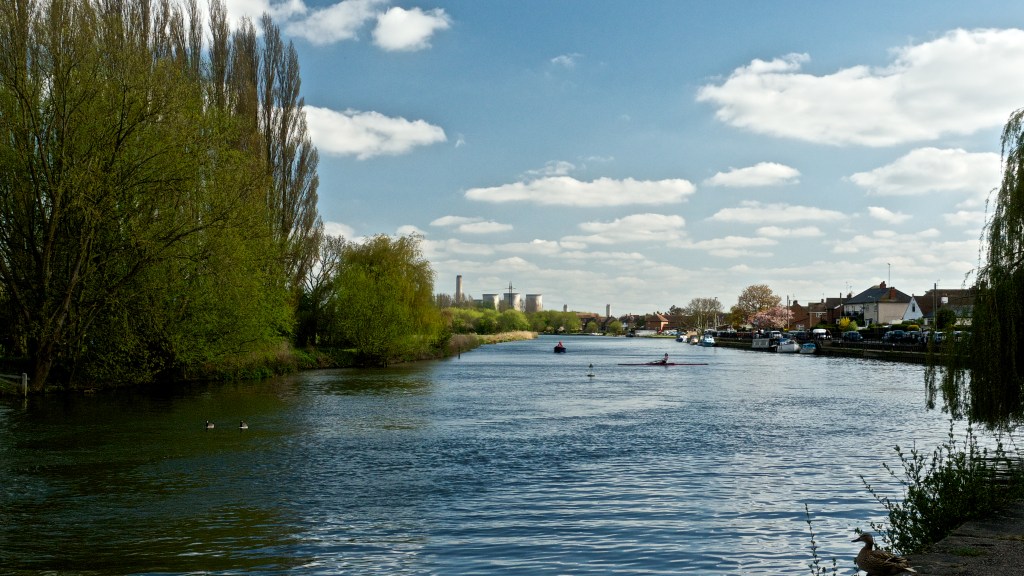
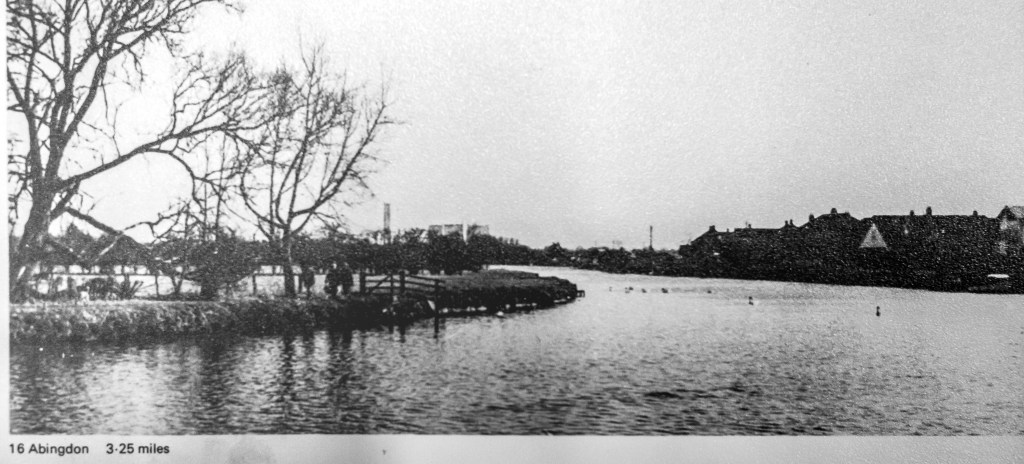
16. Abingdon
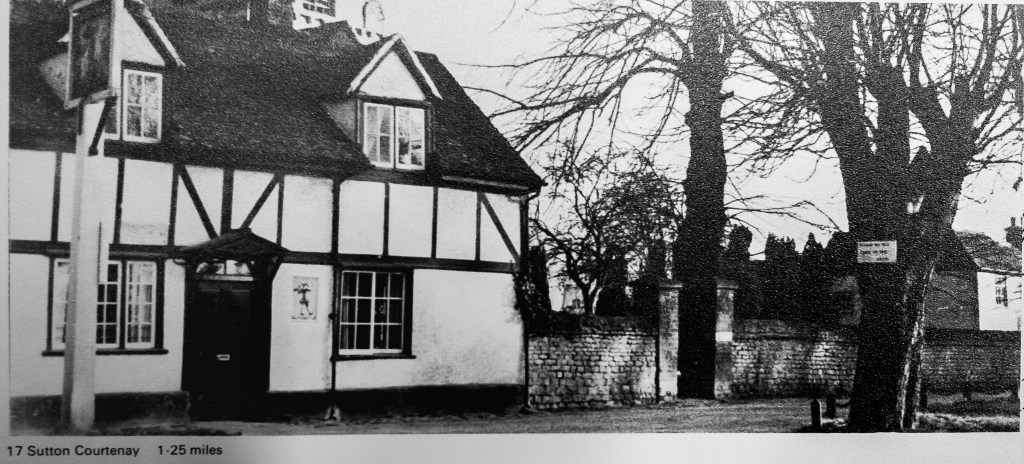
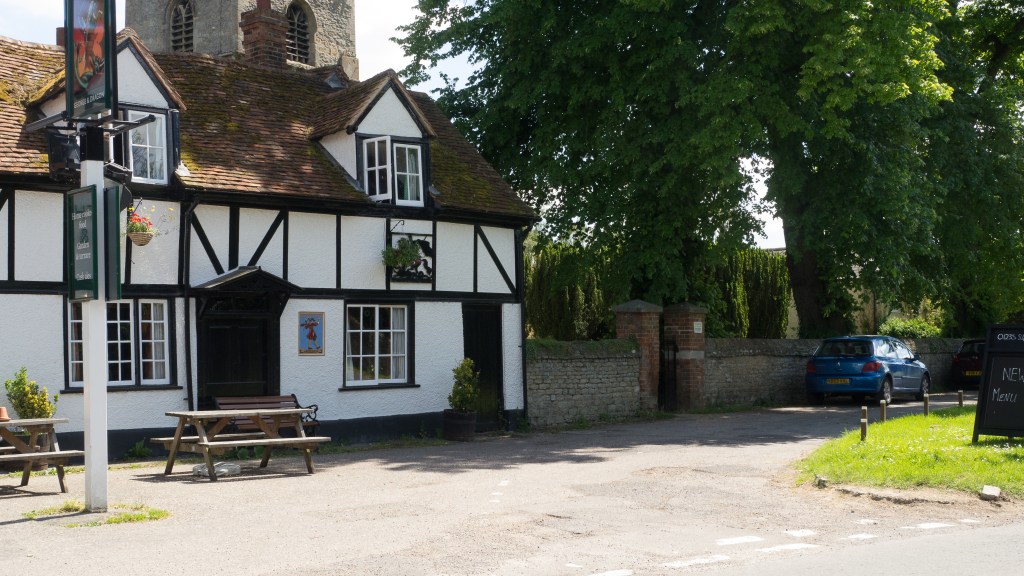
17. Sutton Courtenay